
Resident Feedback Fuels the Framework: Unpacking the 2025 Community Indicators Project Update
At Strategic Spartanburg, we believe that data belongs to the people. That’s why we’ve spent this summer traveling across Spartanburg County, listening to residents during a series of Data Dialogue events to help shape the future of your Community Indicators Project.
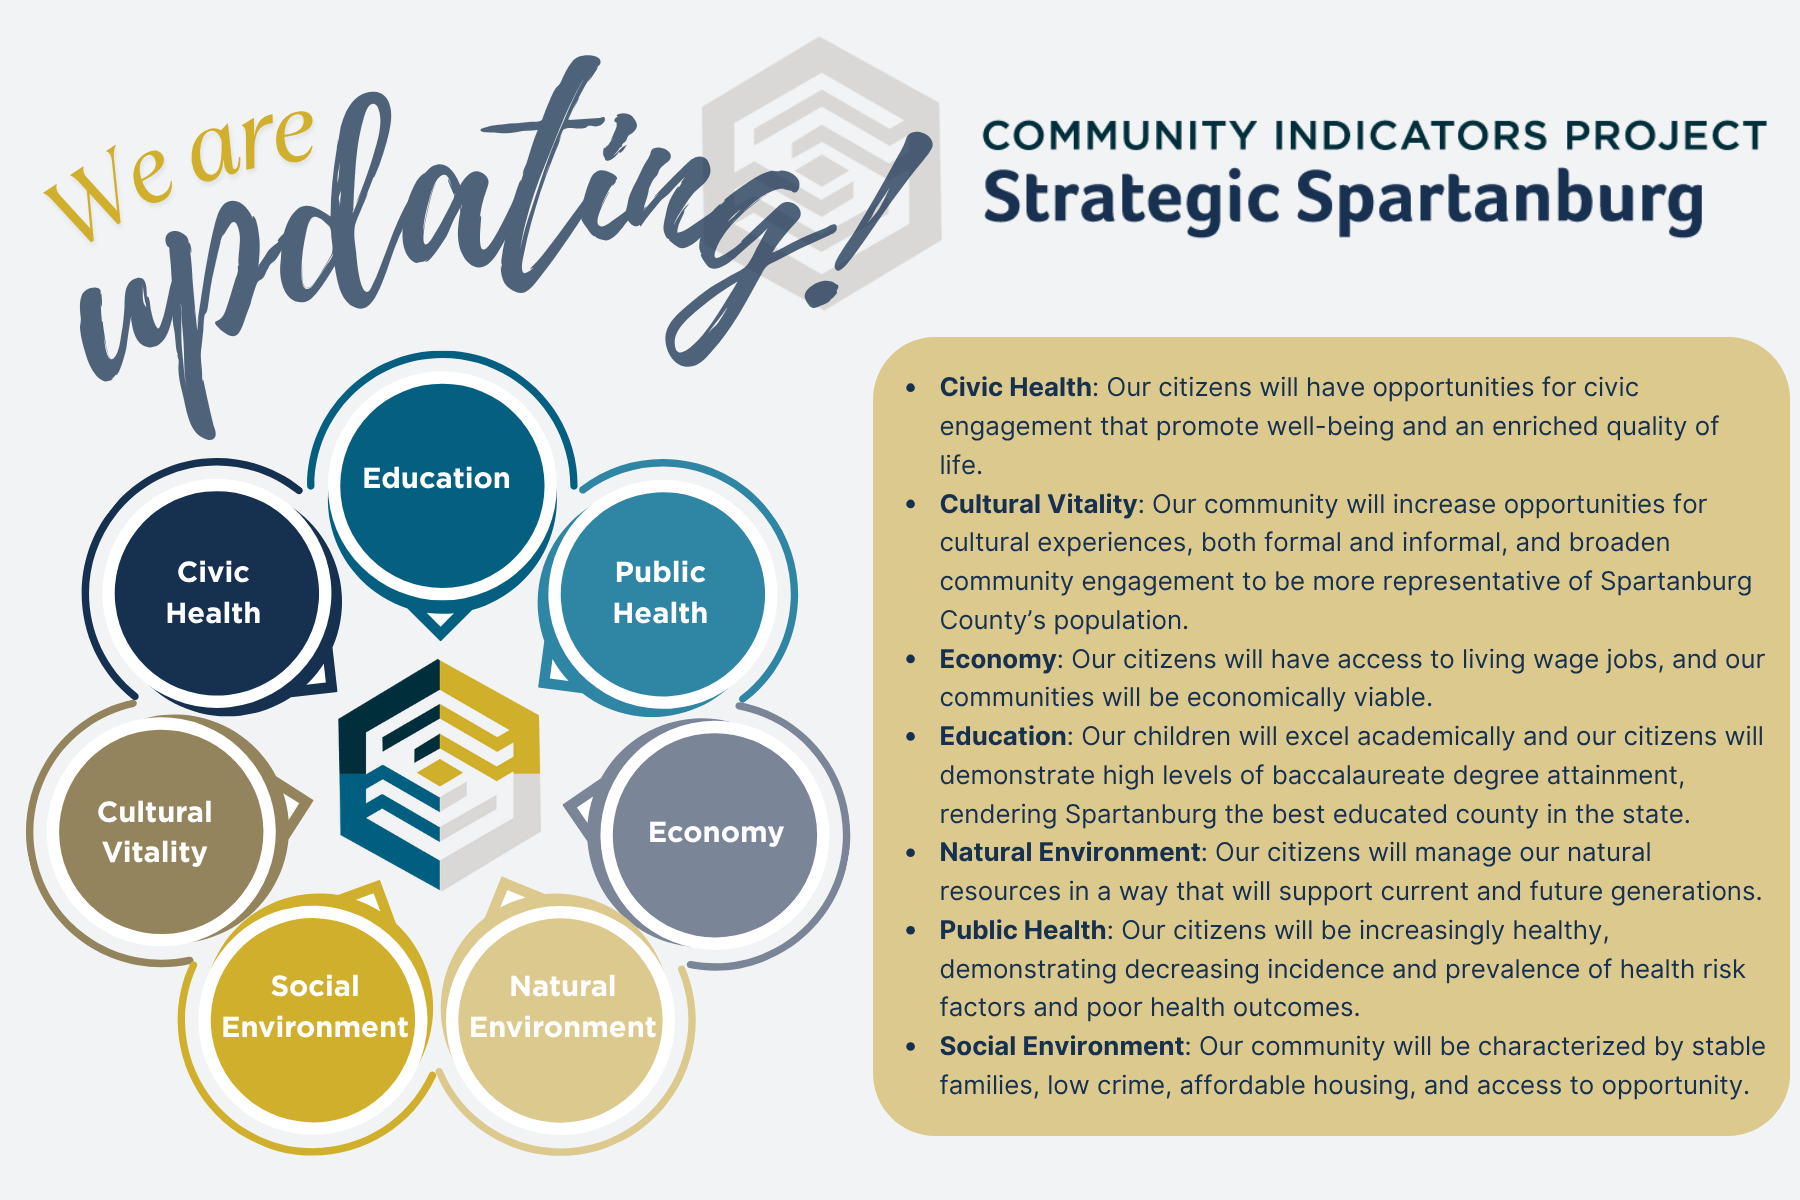
The Community Indicators Project, or CIP, is one of the longest-standing efforts of its kind in the country. It began with a simple but powerful goal: to track data that matters most to our residents. By organizing information across seven key areas of life (Economy, Education, Public Health, Social Environment, Natural Environment, Civic Health, and Cultural Vitality) we’ve built a foundation for understanding where Spartanburg is thriving and where more work is needed. A project like this only works if it reflects the values, experiences, and priorities of the people who call Spartanburg home.
That’s why we launched the CIP Update. We want to make sure the framework (i.e., the seven indicator areas, the goals under each one, and the data we track) still reflects your vision for a thriving Spartanburg.
Taking It to the People: Our Summer 2025 Data Dialogue Events
This summer, we hosted 13 Data Dialogue Events across the county, from Landrum to Woodruff. At each event, our team met residents in libraries, community centers, and even bookstores to talk about what the data represent and what the framework might be missing or underrepresented.
Each session included a “Data Walk” where participants explored large visual posters filled with current data for each of the seven indicator areas. We talked about what’s working well, what needs improvement, and what surprised people most. Then, through “Community Conversations,” we asked participants to reflect on three key questions:
Are there important parts of your life or community that aren’t represented by the current indicator areas?
Do the existing goals match your vision for a thriving Spartanburg?
If you could invest in one indicator area, which would you choose and why?
These conversations gave us a powerful mix of feedback about the numbers and the stories behind them.
What the Data Tells Us Today
Each of the seven community indicator areas includes a set of metrics that help us understand how Spartanburg County is doing in that area. Our Data Walks sparked powerful conversations across the county. Below is a summary of the data our team highlighted at each session.
Economy
This area shows the state of our county’s economy and employment landscape. The Economy indicators include data about poverty, ALICE, median income, capital investments, gross sales, GDP, and the top industries in the county.
Data on median income displays something important: while income has increased slightly for everyone, Black residents still earn about $20,000 less than other groups. This income gap has stayed steady over time. We also looked at the percentage of residents living in poverty and those who are considered ALICE, an acronym for Asset Limited, Income Constrained, Employed. These people are working, sometimes multiple jobs, but still can’t meet basic needs. In Spartanburg County, approximately 14% of residents live below the poverty line, but an estimated 32% are ALICE. When we looked at employment, we saw most residents work in education, healthcare, or manufacturing, with Spartanburg’s school districts and hospital system as major employers.
Education
This area focuses on how our students are doing in school and how well our education system prepares residents for future success. Indicators include preschool enrollment, state testing standards, ACT and SAT scores, graduation and dropout rates, teacher demographics, educational attainment, and median earnings.
Preschool enrollment for 3- and 4-year-olds in Spartanburg County remain steady, mirroring national enrollment trends. Graduation rates were also strong across the county, especially in District 1, which had the highest rates of the seven school districts. We also looked at educational attainment among adults. Most residents either have a high school diploma or have attended college but did not complete a degree. This inspired programs like ReDegree, a OneSpartanburg program powered by Movement2030, which helps adults return to school if they have some college education.
Teacher demographic data told us more. The number of teachers is declining, especially in smaller districts like Districts 3 and 4. We also saw a decrease in inexperienced teachers, meaning more teachers now have four or more years of experience teaching in classrooms.
Cultural Vitality
This indicator area gives a glimpse into cultural experiences within the County with hopes that residents will engage in cultural community events or events that specifically highlight the arts industry. We track the number of arts organizations in the County and what discipline they may highlight. We also track the amount residents spend attending these events, donations given to arts organizations, the number of people who work for these organizations and their wages, attendance at events, and the influence of volunteers.
Spartanburg residents spend about $32 per person to attend local events, while out-of-town visitors spend closer to $50. Most of that goes to food, drinks, lodging, and retail. When we added up spending by arts organizations and audiences, the total came to $78 million in 2022. Despite that, arts industry workers make on average $15,000 to $20,000 per year. We also looked at which kinds of arts organizations are most common. Performing arts, such as concerts and theater, were the largest group, followed by organizations that fall into an “other” category and then visual arts groups.
Civic Health
Civic Health looks at how residents participate in civic life, including voting and volunteerism. Indicators tracked include voter demographics, precincts, party participation, volunteerism, and social communication.
The voter registration map showed high participation in areas like Boiling Springs. But when we looked at turnout by race, we noticed that while participation among white voters increased slightly, participation among Black, Indigenous, and other voters of color declined. Volunteer hours reported by United Way and its partners showed ups and downs from 2020 to 2024, which could be affected by weather, health concerns, or fewer events in certain years.
Public Health
The Public Health indicator gives insight into the physical and mental well-being of Spartanburg residents. Data includes low birth weight, prenatal care, infant mortality, teen pregnancy, hospitalizations, substance overdose rates, and mental health provider access.
We began with low birth weight, which means babies born under 5 pounds and 8 ounces. Spartanburg has lower rates of low birth weight than the state average, which is a positive trend. But when we looked at prenatal care by race and ethnicity, we saw that white mothers were much more likely to receive early care during their first trimester than Black or Hispanic mothers. Infant mortality data was more concerning. The rate rose steadily between 2018 and 2021 before improving slightly in 2022. For every 1,000 babies born in South Carolina, almost 7 die before their first birthday. Spartanburg followed a similar pattern.
Data also showed the top five reasons residents were hospitalized in 2023, with circulatory diseases like heart failure and stroke leading the list. Overdose data showed rising rates for fentanyl, opioids, and prescription drugs.
Natural Environment
The Natural Environment indicator area details data about the state of Spartanburg’s water, waste, air, and animals. We track recycled matter, air matter, weather, greenhouse gas emissions, impaired waters, endangered species, and air quality.
Air pollution, especially particulate matter, can cause breathing and heart problems. While Spartanburg was slightly above the recommended level, the numbers have been going down. Compared to the rest of South Carolina and the United States, our air quality is improving. The Air Quality Index (AQI) also showed that Spartanburg stays mostly in the “good” or “moderate” range. The recycling data gave us a glimpse into how we manage waste. Most recycling came from categories like banned items, organics, metal, paper, and commingled materials. And temperature data showed highs and lows across 2024, which helps us monitor shifts in climate over time.
Social Environment
This area covers the makeup of families in our county and how safe and stable our communities feel. We include median income, family structure, child welfare, crime statistics, and criminal offense records as Social Environment indicators.
The most common crime in Spartanburg County is simple assault, which includes causing or threatening to cause harm to someone. Other frequent offenses include larceny, drug violations, burglary, and property damage. When we looked at child maltreatment reports from 2024, physical neglect was the most reported concern. This means some children aren’t getting their basic needs met at home. Other common issues included risk of harm, physical abuse, and educational neglect. Family income data showed that married-couple households earned the most—around $80,000 to $90,000 per year. In contrast, nonfamily households earned much less, around $30,000 to $40,000. Spartanburg County also has more female-headed households than male-headed ones.
What Happens Next?
Every conversation we had this summer reminded us of how much people care about their communities. Residents from all across Spartanburg County shared thoughtful feedback about what the data means, what might be missing, and how we can better tell the full story of life in our county.
People told us where the current indicators and goals felt accurate, and where they fell short. We heard suggestions for new areas to track, such as housing stability, infrastructure needs, and opportunities for youth. Residents also asked us to be bolder in how we define well-being—not just by the basics, but by what it really means to thrive in Spartanburg.
Now that all 13 events have wrapped up, our team is reviewing everything we heard. That includes analyzing survey responses, reading through hundreds of sticky notes, and summarizing notes taken during group conversations. We are organizing this feedback into major themes that will help us answer three key questions:
Do the current indicator areas still reflect what Spartanburg County values most?
Are there goals or metrics we should revise, remove, or add?
How can the updated framework better track well-being over time?
All of this work will guide the next version of the Community Indicators Project framework. The updated version will be released this fall along with a refreshed digital data dashboard. It will reflect what we heard from you and help us track progress in a way that is meaningful, inclusive, and grounded in community voice.
We aren’t just updating numbers. We’re updating how we understand success. And we’re doing it together—with you.
Thank You, Spartanburg
We are grateful to every person who attended a Data Dialogue Event, filled out a survey, or simply paused to ask a question. Your voice is shaping the future of how Spartanburg tracks progress, defines success, and invests in community well-being.
We aren’t just updating charts or changing goals. We are building a shared vision for the future. And it starts with listening. To stay connected or view the updated Community Indicators Dashboard later this year, visit www.strategicspartanburg.org.